Measuring Training Impact with Chat-Based Analytics: Beyond Completion Rates
The Measurement Crisis in L&D
Ask any L&D leader a simple question - "Is your training working?" - and watch the discomfort. They can tell you how many people completed a course. They can show you satisfaction survey scores. They might even have quiz pass rates.
But ask them whether training reduced safety incidents, improved customer satisfaction, or accelerated onboarding - and the confidence evaporates.
Docebo's 2026 AI Readiness Gap report found that fewer than 25% of learning leaders feel confident connecting learning to business results. More than one in five struggle with stakeholder buy-in. And fewer than half can demonstrate how learning impacts career progression.
This isn't because L&D professionals don't care about measurement. It's because traditional training delivery channels - LMS platforms, classroom sessions, e-learning portals - generate data that's difficult to connect to operational outcomes. Completion rates tell you who finished a course. They tell you nothing about whether behavior changed.
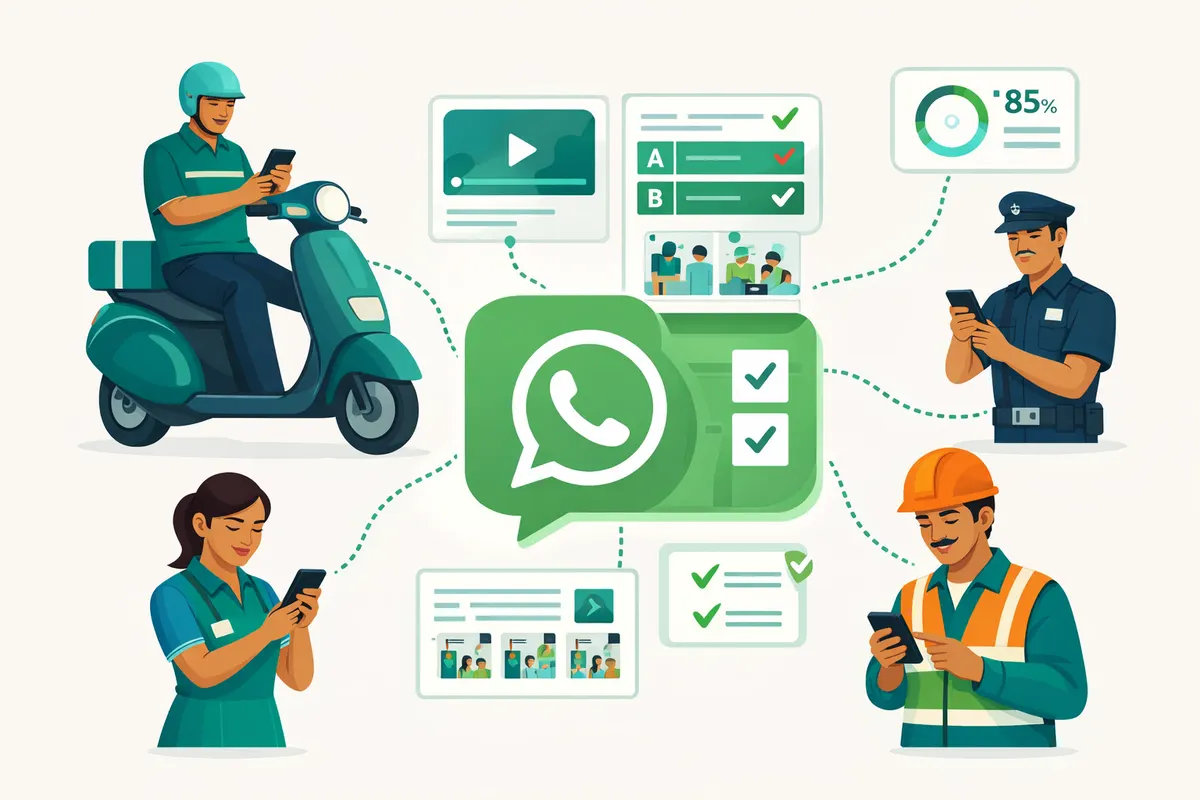
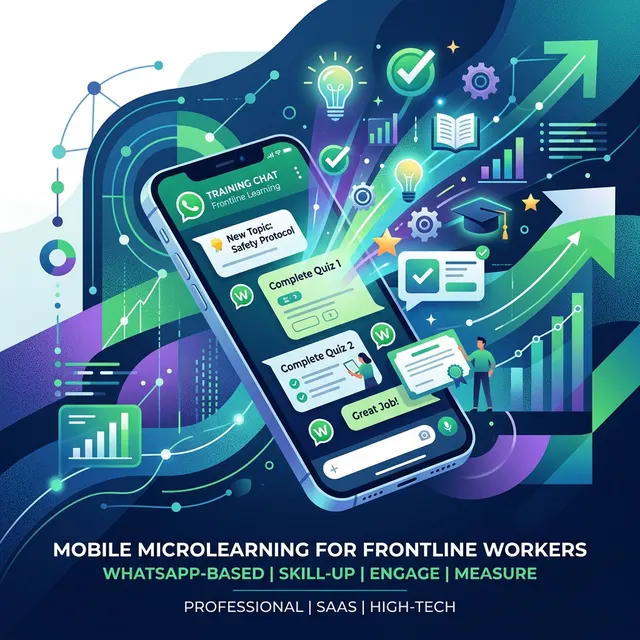
Chat-based training delivery via WhatsApp changes this equation. When training lives inside the same channel workers use every day, the data generated is richer, more granular, and more directly connectable to the metrics that matter.
Why Traditional Training Metrics Fall Short
The Completion Rate Illusion
A 90% completion rate looks impressive in a quarterly report. But what does it actually tell you? That workers clicked through slides. That they reached the end of a module. That the LMS recorded a "complete" status. It tells you nothing about whether they understood the content, retained the knowledge, or changed their behavior.
In traditional LMS environments, completion is often gamed - workers click "next" rapidly to get through mandatory modules, especially when they know the system only tracks whether they reached the final screen.
The Satisfaction Survey Gap
Post-training surveys measure how workers feel about training, not what they learned from it. A worker might rate a training session 5/5 because the facilitator was entertaining - while retaining nothing. Conversely, challenging training that pushes workers outside their comfort zone might score low on satisfaction but drive significant behavior change.
The Time-Lag Problem
Traditional training generates data at the moment of training. But the impact of training shows up weeks or months later - in reduced safety incidents, improved quality metrics, or faster onboarding. By the time these operational metrics are available, they're difficult to attribute to a specific training intervention because too many other variables have changed.
What Chat-Based Analytics Unlock
When training is delivered through WhatsApp, every interaction generates data that traditional channels can't capture:
Real-Time Engagement Signals
WhatsApp has a 98% message open rate in India compared to 20-30% for corporate email. When a training module arrives as a WhatsApp message, you can track:
- Open rate: Did the worker tap on the training link?
- Time to open: How quickly did they engage after delivery? Minutes or days?
- Completion time: How long did they spend on the module? (A 3-minute module completed in 30 seconds suggests clicking through without reading)
- Drop-off point: If they didn't complete, where exactly did they stop?
These signals are available in real-time - not after a quarterly LMS pull. If completion drops at a specific facility after a shift change, you know immediately rather than discovering it in next month's report.
Active Knowledge Assessment
Chat-based training modules naturally embed quizzes, polls, and knowledge checks into the flow of learning. Unlike traditional assessments that workers study for and then forget, these are lightweight knowledge checks embedded in 3-minute modules:
- Quiz accuracy by topic: Which specific safety topics are workers struggling with?
- Quiz accuracy by location: Is machine lockout knowledge weaker at your Pune plant than your Chennai plant?
- Quiz accuracy over time: Are spaced repetition modules improving scores between Day 1 and Day 35?
- Response patterns: Are workers consistently getting the same question wrong, indicating a content clarity issue rather than a knowledge gap?
Behavioral Intent Signals
Chat-based training can include action commitments - "Will you apply this technique in your next shift? Tap YES/NO." While self-reported intent isn't the same as observed behavior, patterns of intent across thousands of workers provide valuable directional data.
The Kirkpatrick Framework for Chat-Based Training
Donald Kirkpatrick's four-level evaluation model remains the gold standard for training measurement. Here's how chat-based analytics map to each level:
Level 1: Reaction
Did workers engage with the training?
Chat-based metrics:
- Message open rates
- Module completion rates
- Time spent on each module
- Voluntary re-engagement (workers returning to review content)
- Satisfaction polls embedded in the module
Benchmark: WhatsApp-delivered microlearning typically achieves 85%+ completion rates versus 20-30% for traditional LMS. If you're seeing lower numbers, investigate content relevance, delivery timing, or language match.
Level 2: Learning
Did workers acquire the intended knowledge?
Chat-based metrics:
- Quiz scores on immediate knowledge checks
- Score improvement across spaced repetition intervals
- Accuracy on scenario-based questions
- Comparison of pre-training and post-training assessment scores
- Knowledge retention rates at Day 8, Day 17, and Day 35
Benchmark: Aim for 80%+ quiz accuracy on core safety and compliance topics. Scores below 60% suggest content needs to be redesigned or delivered in a different language.
Level 3: Behavior
Did workers change their on-the-job behavior?
Chat-based metrics (direct):
- Action commitment responses ("Will you apply this today?")
- Follow-up self-assessments ("Did you use the technique this week?")
Operational metrics (indirect, correlated):
- Safety incident rates before and after training
- Quality audit scores correlated with training completion
- Customer satisfaction trends linked to service training
- Speed-to-productivity for new hires vs training completion timeline
Benchmark: This is where the real value lies. A training program that achieves 90% completion but shows no change in safety incidents is failing at Level 3. A program with 70% completion that correlates with a 40% reduction in safety incidents is succeeding.
Level 4: Results
Did training drive measurable business outcomes?
Business metrics correlated with training data:
- Safety incident cost reduction
- Compliance violation fines avoided
- Attrition rate changes (workers who receive consistent training show lower turnover)
- Onboarding time reduction and its cost impact
- Customer satisfaction score improvements and revenue impact
Real-world examples from Leap10x deployments:
- A leading Indian manufacturing firm saw a 40% reduction in safety incidents after deploying microlearning via WhatsApp
- A mobility company achieved a 23% improvement in onboarding time and 10% reduction in onboarding costs
- Customer satisfaction improved by 3% following targeted service training delivered via WhatsApp
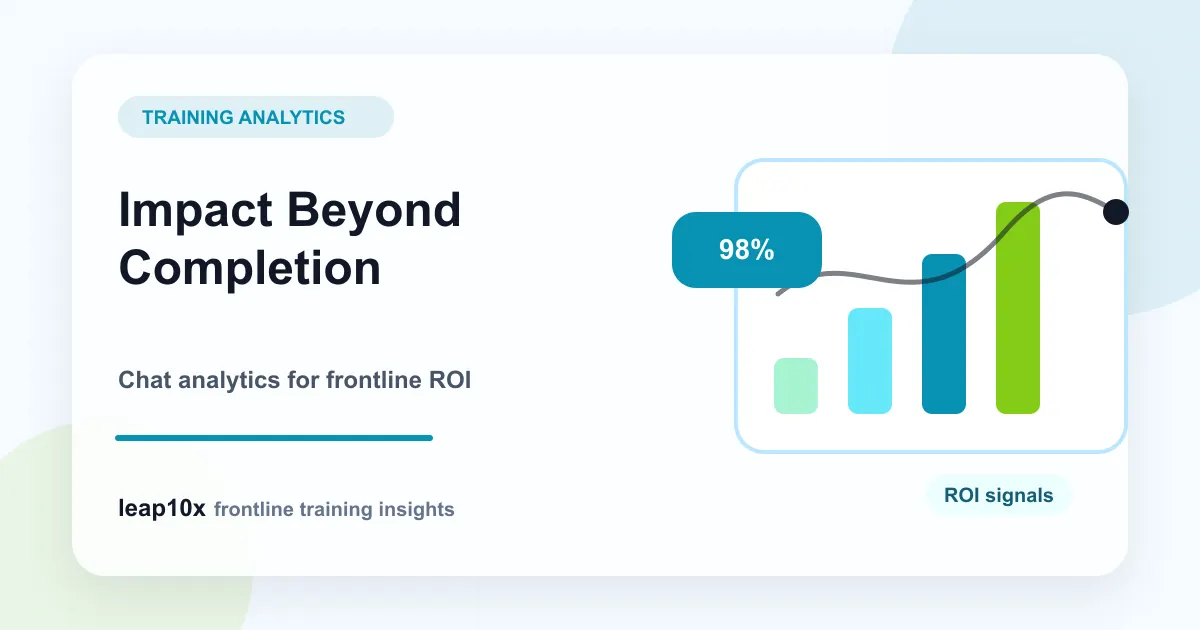
Building Your Chat-Based Analytics Dashboard
Essential Metrics (Track from Day 1)
- Delivery rate: Percentage of workers who received the training message
- Open rate: Percentage who tapped the training link
- Completion rate: Percentage who finished the module
- Quiz accuracy: Average score on knowledge checks
- Time-to-completion: Average time spent per module
Advanced Metrics (Track after 30 days)
- Retention rate: Quiz score comparison across spaced intervals
- Engagement trend: Is completion improving or declining over time?
- Knowledge gap map: Which topics score lowest across which locations?
- Completions by role/shift/language: Identify patterns in who engages and who doesn't
Impact Metrics (Track quarterly)
- Safety incident correlation: Do sites with higher training completion have fewer incidents?
- Attrition correlation: Do workers who complete training stay longer?
- Onboarding velocity: Do trained new hires reach productivity faster?
- Compliance audit results: Do sites with spaced training refreshers pass audits at higher rates?
Making Data Actionable
Data without action is just noise. Here's how to turn chat-based analytics into decisions:
Weekly Review
Every Monday, review completion rates and quiz scores from the previous week. Identify any site or role where engagement dropped and investigate - was there a shift change? A supervisor who discouraged phone use? Content that didn't resonate?
Monthly Gap Analysis
Map quiz accuracy by topic, location, and role. Identify the three biggest knowledge gaps and prioritize content interventions. If forklift safety scores are consistently low at your Lucknow warehouse, create a targeted refresher series for that specific team.
Quarterly Impact Review
Correlate training data with operational metrics. Present findings to business stakeholders in their language - not "completion rates improved by 15%" but "safety incidents dropped 40% at sites where training completion exceeded 80%."
This is how you build the business case that fewer than 25% of L&D leaders can currently make. Not through training metrics - through business metrics connected to training data.
The Bottom Line
The gap between "we delivered training" and "training made a difference" is the central challenge of modern L&D. Traditional metrics - completion rates, satisfaction scores, session attendance - sit on one side of that gap. Operational outcomes - safety records, customer satisfaction, productivity, attrition - sit on the other.
Chat-based analytics from WhatsApp-delivered training bridges the gap. Real-time engagement data, embedded knowledge assessments, spaced retention tracking, and direct correlation to operational KPIs give L&D teams the evidence they need to prove impact and justify investment.
Stop measuring whether workers finished training. Start measuring whether training finished the job.
Get analytics that prove training impact. Leap10x's real-time dashboard tracks completion, knowledge retention, and knowledge gaps - then connects it to safety, productivity, and attrition outcomes. See the dashboard.